docs / https / zabbix-agent-install-debian
zabbix agent install ( bookworm_12)
wget https://repo.zabbix.com/zabbix/7.0/debian/pool/main/z/zabbix-release/zabbix-release_7.0-1+debian12_all.deb
dpkg -i zabbix-release_7.0-1+debian12_all.deb
apt updateapt install -y zabbix-agentnano /etc/zabbix/zabbix_agentd.confChange the following lines:
Server=127.0.0.1Replace with the IP address of your Zabbix server (parent VM):
Server=ZABBIX_SERVER_IP Optional: To allow server and frontend connections, also set:
ServerActive=ZABBIX_SERVER_IP(Optional but recommended) Set a hostname for this VM:
Hostname=debian12-vm-01 Save and exit: Press Ctrl+X, then Y, then Enter.
systemctl restart zabbix-agent systemctl enable zabbix-agentThe agent will now listen on port 10050 (default).
Confirm it’s running:
systemctl status zabbix-agentAllow Zabbix Server to Access the Agent (if you use a firewall)
If using UFW:
ufw allow from ZABBIX_SERVER_IP to any port 10050 proto tcpLog in to your Zabbix web interface: http://ZABBIX_SERVER_IP/zabbix
Navigate to**:****Data collection > Hosts
Click : CREATE HOST
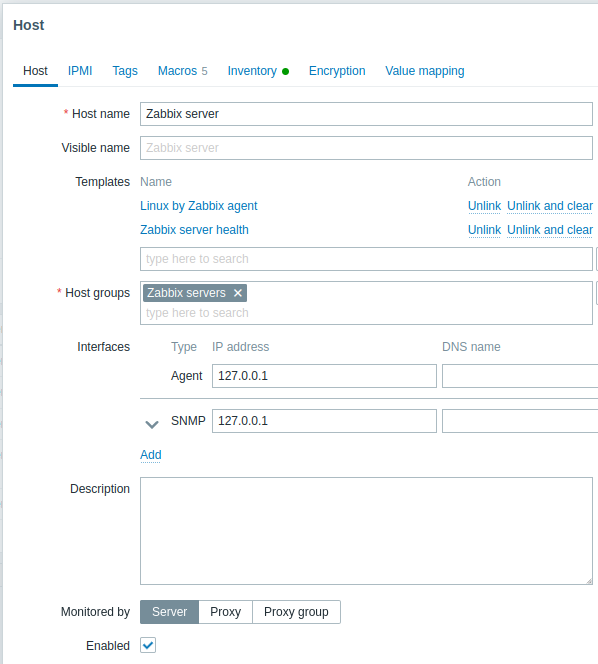
Fill in the new host details:
Host name: (Use the same as Hostname in agent config, e.g. debian12-vm-01)
Visible name: (optional–displayed in UI, can match host name)
Groups: Click “Select” and choose an existing group like “Linux servers,” or create your own.
Agent interfaces:
IP address: IP of the Debian 12 VM
Port: 10050 (default)
Leave “DNS name” blank unless using DNS
Assign a Template: (Ensures correct monitoring items are created automatically)
Go to the “Templates” tab.
Click “Select.”
Search for and choose Template OS Linux by Zabbix agent.
Click “Add” to attach the template.
Click “Add” at the bottom of the Host creation page to save the configuration.
Confirm Data Collection
- Go to “Monitoring” → “Hosts” or “Latest data”
- Within a minute or two, the host’s status should display as green (enabled/monitored) and data will start appearing.